Understanding TCGA mRNA Level3 analysis results files from FireBrowse
The corresponding gitlab repo: understanding-firebrowse-data-format.
A useful quote from http://seqanswers.com/forums/showthread.php?t=42911.
It took me a while to get my head around this, since the column names in the rsem.genes/isoforms.results files don’t match the default output of RSEM, neither the version they claim to have used nor the most current version.
The (first) RSEM paper explains that the program calculates two values. One represent the (estimated) number of reads that aligned to a transcript. This value is not an integer because RSEM only reports a guess of how many ambiguously mapping reads belong to a transcript/gene. This number is what the TCGA slightly misleadingly calls raw counts.
The scaled estimate value on the other hand is the estimated frequency of the gene/transcript amongst the total number of transcripts that were sequenced. Newer versions of RSEM call this value (multiplied by 1e6) TPM - Transcripts Per Million. It’s closely related to FPKM, as explained on the RSEM website. The important point is that TPM, like FPKM, is independent of transcript length, whereas “raw” counts are not!
The *.normalized_results files on the other hand just contain a scaled version of the raw_counts column. The values are divided by the 75-percentile and multiplied by 1000. This should make the values a bit more comparable between experiments. The Perl code for this quantile normalisation can be found here.
In conclusion, I would strongly recommend using the TPM/scaled_estimate values for all intents and purposes. It seems to me to be the more robust and mathematically sound value.
I am trying to figure out which mRNA analysis results file from Firehose I should use for differential gene expression (e.g. with DESeq2). However, I find the documentation relatively poor. As I have spent quite some time figuring out all the details, I decided to share what I’ve found here so future users don’t need to.
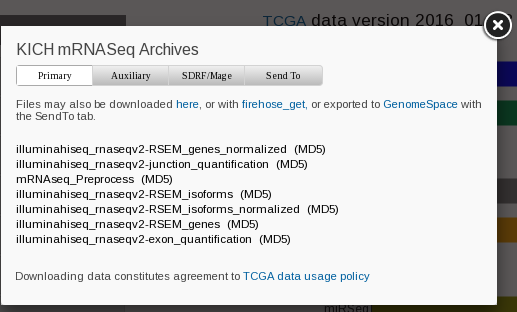
I am currently looking at KICH. If you click KICH at http://firebrowse.org/, and then click mRNA, you see the following pop up menu.
I tried to understand all the difference, and found the following pages somewhat helpful.
- confluence.broadinstitute.org
- wiki.nci.nih.gov (This is about the RNASeqV2 pipeline in general)
Based on the description of the second link, I thought I would be interested in
the illuminahiseq_rnaseqv2-RSEM_genes file as DESeq2 require expression values
as close to raw count as possible.
However, when I download it and look inside, it contains headers as such with very long lines.
Hybridization REF TCGA-KL-8323-01A-21R-2315-07 TCGA-KL-8323-01A-21R-2315-07.1 TCGA-KL-8323-01A-21R-2315-07.2 TCGA-KL-8324-11A-01R-2315-07 TCGA-KL-8324-11A-01R-2315-07.1 TCGA-KL-8324-11A-01R-2315-07.2 ...
0           gene_id                    raw_count                scaled_estimate                  transcript_id                    raw_count                scaled_estimate                  transcript_id ...
1       ?|100130426                         0.00                              0                     uc011lsn.1                         0.00                              0                     uc011lsn.1 ...
2       ?|100133144                        22.18           5.56262138762192e-07          uc010unu.1,uc010uoa.1                        20.92           5.66666965654224e-07          uc010unu.1,uc010uoa.1 ...
3       ?|100134869                        13.82           2.50584617744958e-07          uc002bgz.2,uc002bic.2                        17.08           3.34550559455013e-07          uc002bgz.2,uc002bic.2 ...
4           ?|10357                       247.31           1.44524322577865e-05                     uc010zzl.1                       328.97           2.06751089262803e-05                     uc010zzl.1 ...
5           ?|10431                      1814.00           4.74864023757294e-05          uc001jiu.2,uc010qhg.1                      2691.00           7.60539144597261e-05          uc001jiu.2,uc010qhg.1 ...
...
So for each sample, there are three columns (barcode, barcode.1, barcode.2)
corresponding to raw_count, scaled_estimates, and transcript_id(s). I find
the file format is not very intuitive, and creates inconvenience for future
parsing. Such nested structure would’ve been much better handled by
XML/JSON/YAML, etc instead.
The normalization method is briefly described in the first link
RSEM expression estimates are normalized to set the upper quartile count at 1000 for gene level and 300 for isoform level estimates. These files have two columns, feature name and normalized count
I also looked into the mRNAseq_Preprocess link, which was not described in the
above links. I found an overly short description
here:
mRNAseq_preprocessor: Pick the “normalized_count”(quantile normalized RSEM) value from illumina hiseq/ga2 mRNAseq level_3 (v2) data set and make the mRNAseq matrix with log2 transformed for the downstream analysis. To maximize sample counts we include both HiSeq and GA2 aliquots in each cohort dataset, but if a given patient has both HiSeq and GA2 aliquots the HiSeq aliquot will take precedence (to avoid double-counting a patient during analysis). The pipeline also will create the matrix with RPKM and log2 transform from hiseq/ag2 mRNAseq level 3 (v1) data set.
Z score calculation of RSEM/RPKM data:
Z = (expression in single tumor sample) - (mean expression in all tumor samples ) / (standard deviation of expression in all tumor samples)
The Preprocess files after download look like this
KICH.uncv2.mRNAseq_RSEM_Z_Score.txtKICH.uncv2.mRNAseq_RSEM_normalized_log2.txtKICH.uncv2.mRNAseq_RSEM_normalized_log2_PARADIGM.txtKICH.uncv2.mRNAseq_RSEM_all.txtKICH.uncv2.mRNAseq_raw_counts.txtKICH.uncv2.mRNAseq_scaled_estimate.txtKICH.uncv2.mRNAseq_geneid_transcriptid_mapping.txtMANIFEST.txt
File 1 and 2 are briefly explained in the above quote. I don’t quite understand
why that is called a Z score, the formula is equal to standardization (i.e.
removing mean, and scaled to unit variance). Also, it does not say if how
normal/metastatic samples’ Z scores are calculated. File 3 is not described, but
PARADIGM seems to be related to pathway analysis (keyword search within that
linked page). File 4 and 5 are likely extracted from the raw_count and
scaled_estimate columns of the RSEM_genes (unnormalized) file mentioned
before. I checked a few genes and File 7 seems to the same as the
RSEM_genes_normalized file (but slightly different file formats), consistent
with the description of mRNAseq_preprocessor part under RNAseq Pipelines
section.
I think the documentation could’ve been much improved so that no one needs to hack around file formats, which bioinformaticians have already spent too much time doing so in general.
Back to my own problem, I prefer to use RSEM_genes (unnormalized) file over
the raw_count file for differential expression analysis with DESeq2, as the
later uses short 12-letter barcode (e.g TCGA-KL-8323-01), which may be
unspecific enough for later analysis.