Process graph
I was reading the chapter on Processes (Chapter 3) from the book Operating System Concepts 10th Edition, and got curious about the available processes on my laptop (A MacBook Pro).
I used the psutil Python library to
obtain all available processes and arrange them into a graph where each node is
a process and each edge is a parent process => child process relationship. I
visualized the graph with Gephi using the Yifan Hu layout
as shown below:
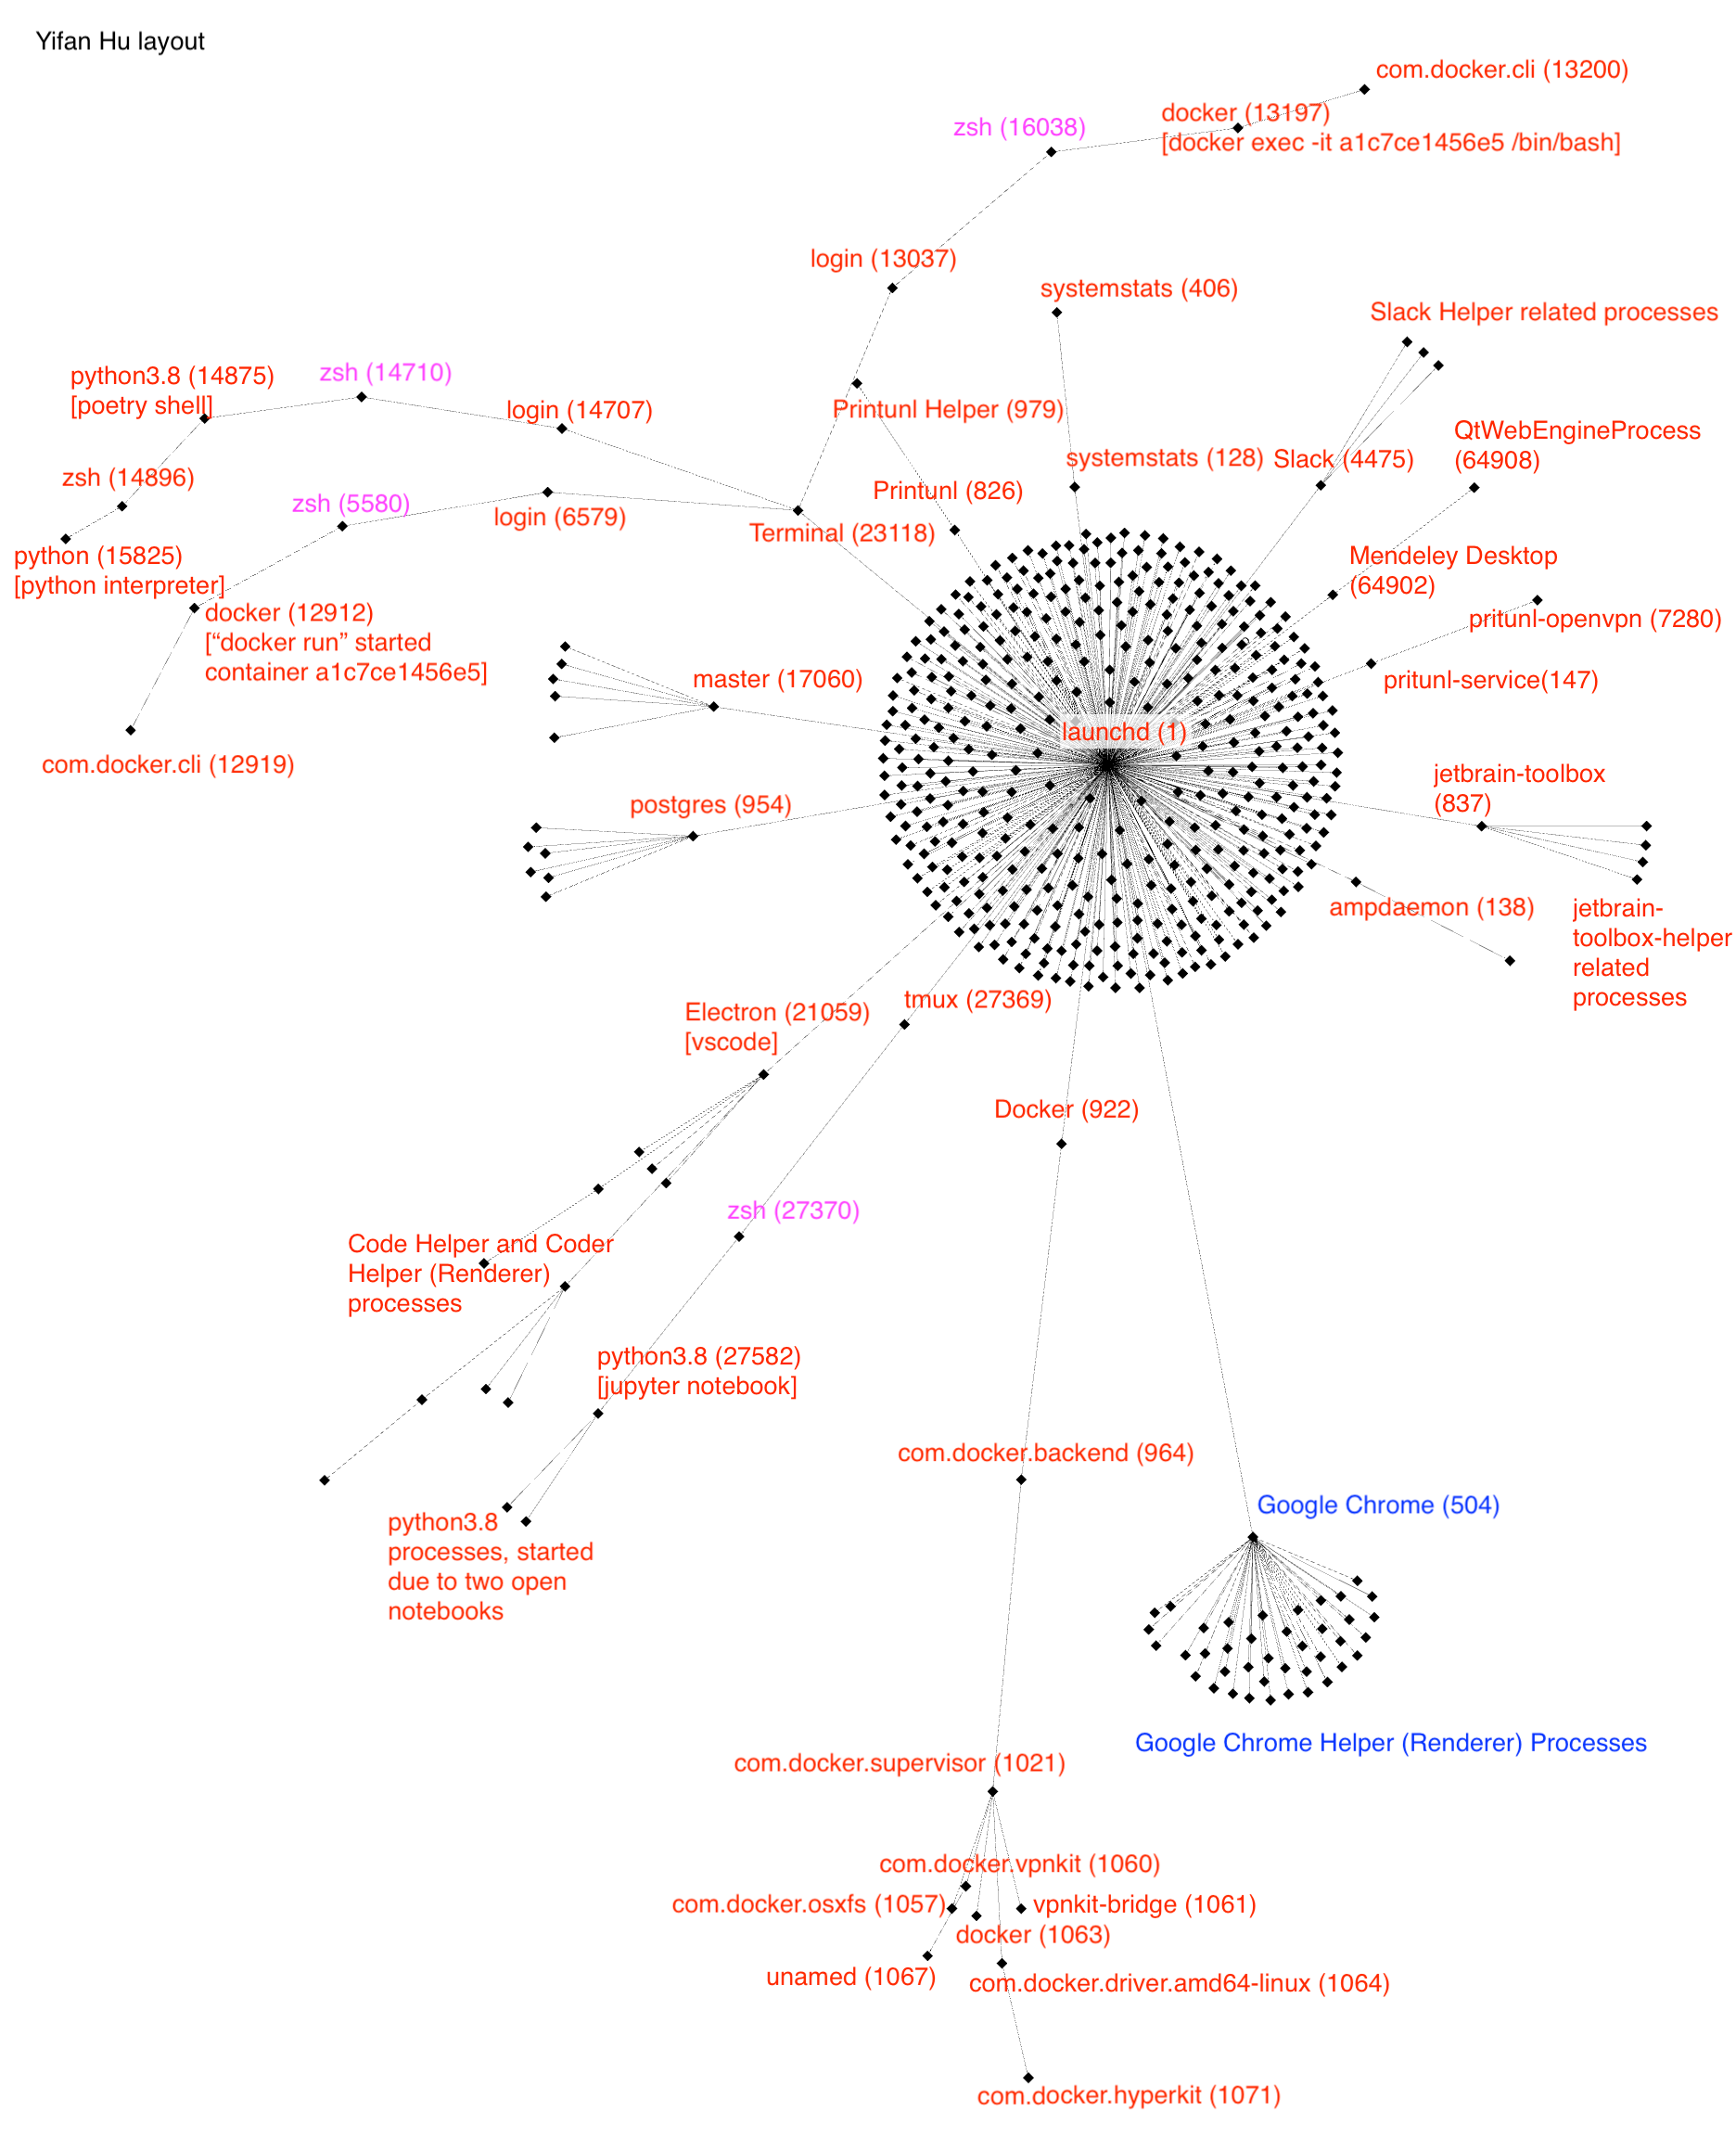
The process graph is also a tree because
- Each child process can only have up to one parent process.
- No cycle exists, i.e a process cannot be both an ancestor and descent process of another process.
- All processes are connected, i.e. only one connect component exist.
Some interesting observations:
- Center: launchd (1) is the root
process with a PID of 1 and every other process is its descendent.
launchdalso has a large number of direct children as shown in the cluster of points around it. - Lower right: Each Google Chrome tab is a separate process, which are all children of the
Google Chrome (504)process. - Upper left: I find the process lineage of a Python interpreter running
inside a poetry virtual environment informative:
launchd (1) =>Terminal (23118) =>: the Mac Terminal applogin (14707) =>zsh (14710) =>Python 3.8 (14875) =>: started by poetry shellzsh (14896) =>python (15825) =>: the interpreter.
- Lower left: it shows that tmux
(27369) is a direct child of
lanuchd (1), which explains why closing Terminal app won’t kill processes run inside tmux. - The graph also shows the Docker (922)
 backend
(bottom) was started by
launchd (1)and involve multiple processes, anddocker runanddocker exec(docker (13197)create their separate processes within Terminal:- Upper left:
Terminal (23118) => login (6579) => zsh (5580) => docker (12912) [docker run] => com.docker.cli (12919) - Upper right:
Terminal (23118) => login (13037) => zsh (16038) => docker (13197) [docker exec] => com.docker.cli (13200)
- Upper left:
The code for calculating the process: